
Temporal Graph Attention Network Prediction on Ethereum Transaction Cost and Analysis on ‘The Merge’
The Merge aimed to resolve the disadvantages of ETH 1.0 of low scalability and high energy consumption. By merging the PoS Beacon Chain to the main chain, the Merge reduced about 99.95\% Ethereum’s energy consumption. Our goal is to analyze this big event for Ethereum. We carry out descriptive analysis comparing data before and after the Merge. As for application, we present a GNN model based on the embedding of transaction networks. We are interested in the Gas Price, which is of great economic value, and ‘The Merge’ takes one step closer to sharding, which will increase the processing speed of the Ethereum mainnet and lower the transaction fees.
Based on prior works, we intend to combine temporal and graphical information to improve prediction performance. We apply graph attention convolution (GATConv) and global pooling to obtain embeddings of the entire graph, and causal Transformer to learn temporal dependencies.
Data
We used Ethereum ETL to manipulate and integrate our data into our database in Google Cloud Platform. There are about 1.1 million transactions generated each day, and we collected about 250 GB over the past few months.
Data Preprocessing
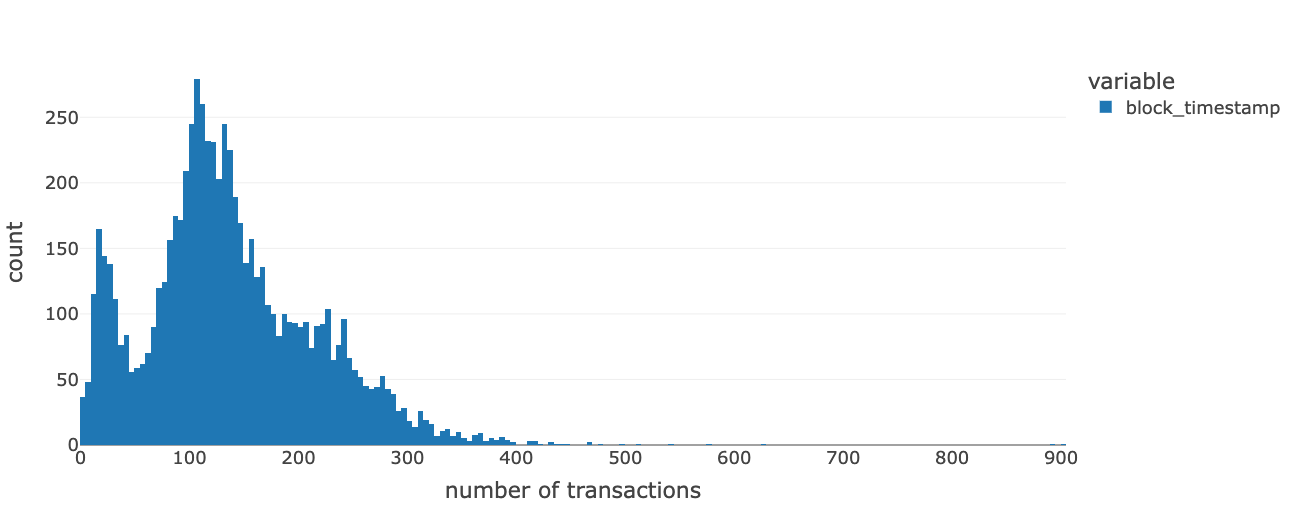
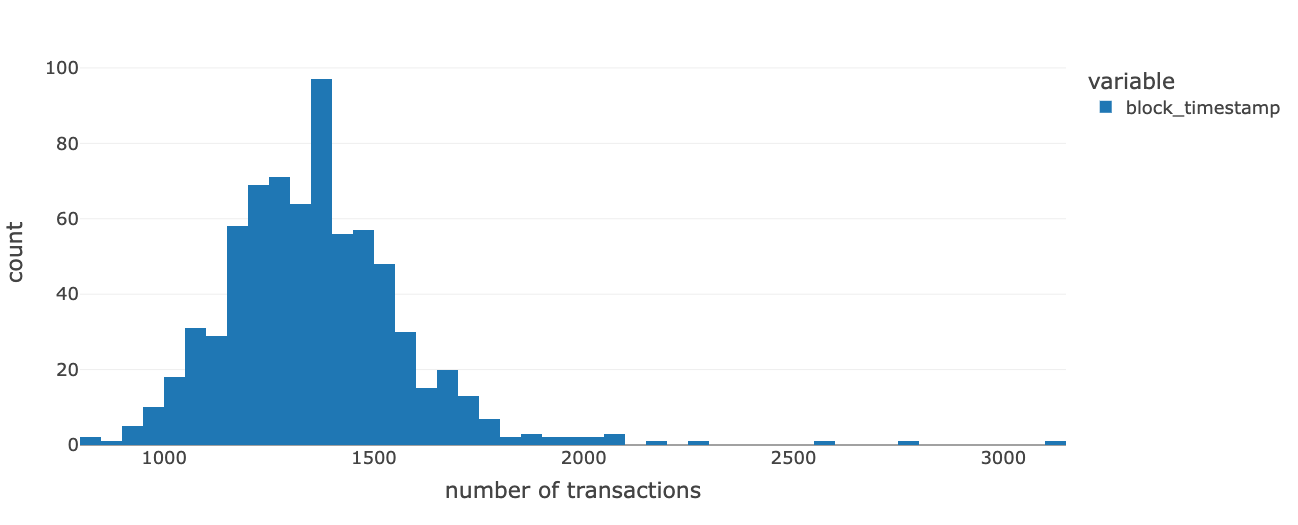
The first step is to aggregate transactions by time. The number of transactions per block can vary dramatically, ranging from 1 transaction to approximately 900 transactions in one single block. The vastly changing size of blocks presents challenges to accurately predicting the minimal gas price in each block. However, the number of transactions against time shows consistency. In practice, it is more important to consider the delay rather than the actual block. Therefore, we aggregate the transactions by a non-overlap sliding window with a length of 2 minutes.
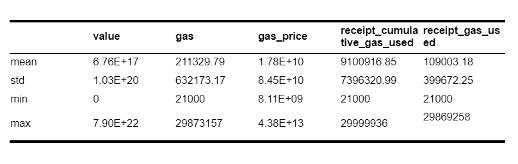
The second step is data normalization. The raw data we collected has features on different scales. The gas price and value are both in GWei, and since 1 GWei equals 0.00000000119 ETH, both features contain great values. The value transferred on average is 6.76E+17 and the mean of gas price is 1.78E+10, while the average of gas is 2.11E+5. Data normalization can be crucial to the model’s performance. We used Z-score normalization for each feature separately.
The last step is to mini-batch along the diagonal for consecutive graphs to create a giant graph. The data loader is built on these giant graphs to preserve the order of sequence.
Method
Descriptive Analysis: Transaction Graphs Comparison
The transaction networks are constructed based on two months’ data, August and October, one month before and one month after “The Merge.” According to the field ‘from_address’ and ‘to_address’ in the datasets, we construct two directed and weighted graphs. Each edge represents the transaction relationship between two users. By aggregating features from our data, we also track some attributes of the transaction relationships, including the total transaction times, transaction value, and minimum gas price between two users.
Based on the two networks, we compared metrics as follows: node degrees, edge attribute distributions, and graph centralization, which measure the extent to which one or more nodes occupy the central positions of a graph.
Predictive Analysis: Gas Price Prediction
Proposed model: ETHGT
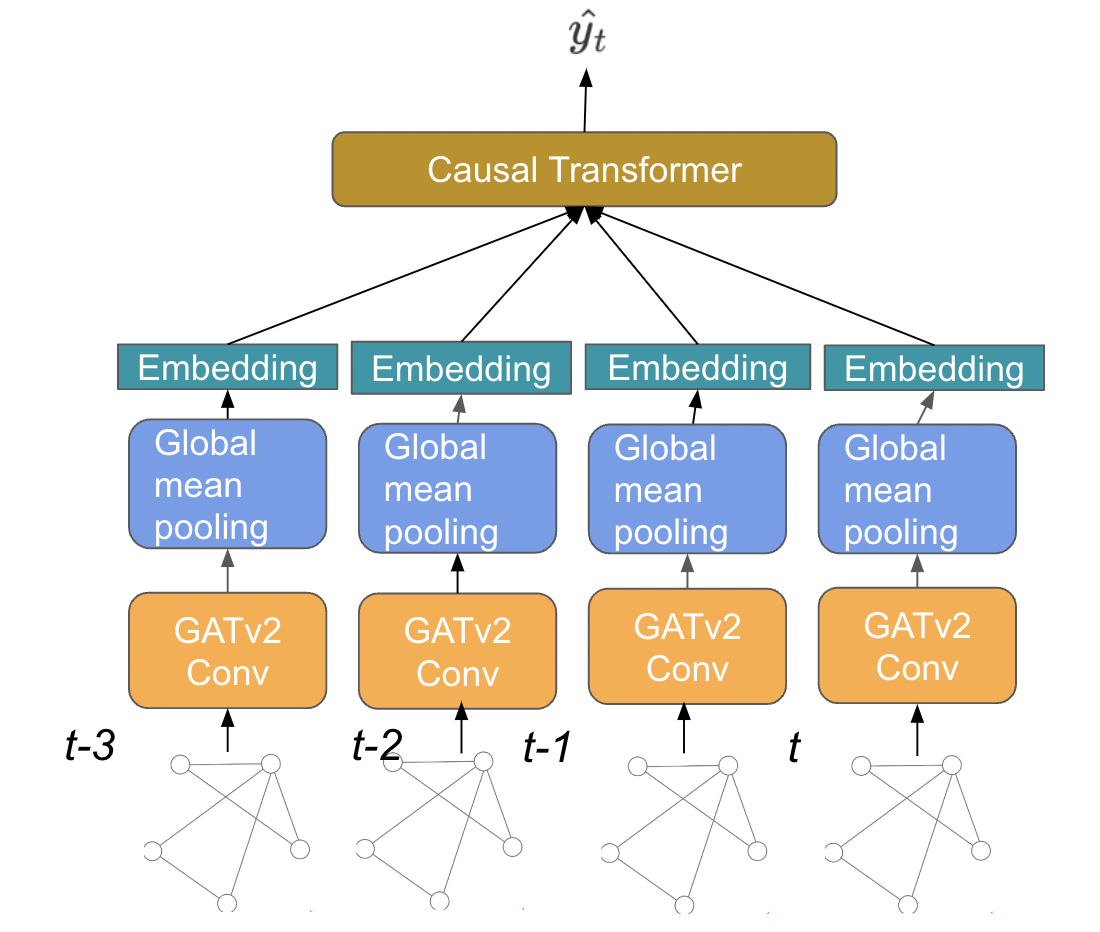
We proposed a novel model named ETHGT, whose structure is shown at fig below. The model applies the same Graph Attention Convolution Blocks for a consecutive of graphs, the extracted features are passed through global mean pooling to get the embedding for the transaction graph. The embedding from each timestep is then fed to causal Transformer. The output is a single float number which represents the estimate lowest gas price in the next serval minutes.
Label
to label the data. For each block, only transactions processed were recorded, so that the minimum gas price in each block is the lowest gas price for the transaction to be considered(in this block). After aggregation and normalization, we compute the minimum gas price $m_i$ within each graph $i$. Then we compute $y_i=\min_{k\in{i+1,i+2,…,i+l} )}m_k $, which is the minimum of consecutive minimum gas prices.
Result
Analysis on “The Merge”
Through d3.js, we conduct visualization of two smaller subgraphs of the original Pre- and Post-Merge graphs, where we can discern patterns and gain insights in terms of the overall transaction structure on Ethereum. The subgraphs are obtained through setting thresholds of at least 30 degree and at least 10 transaction times, and filtering the original graphs.
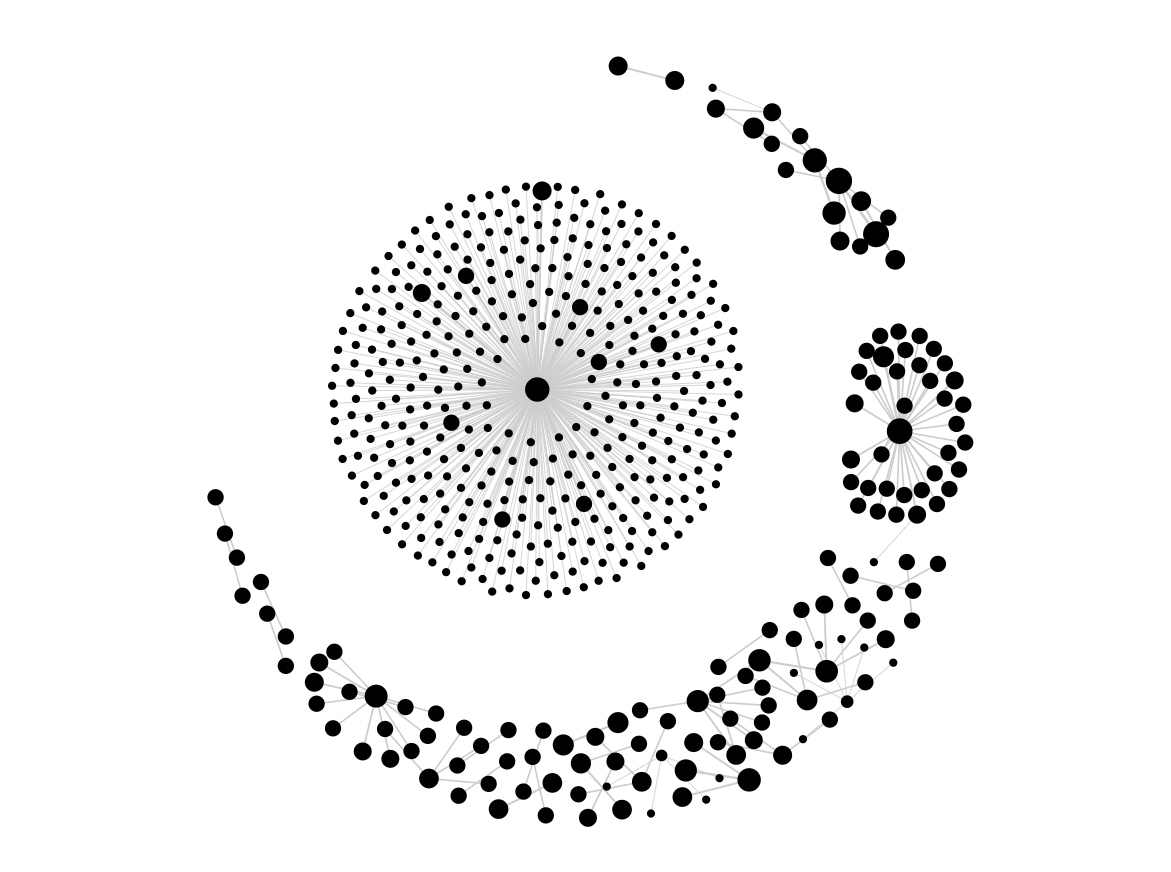
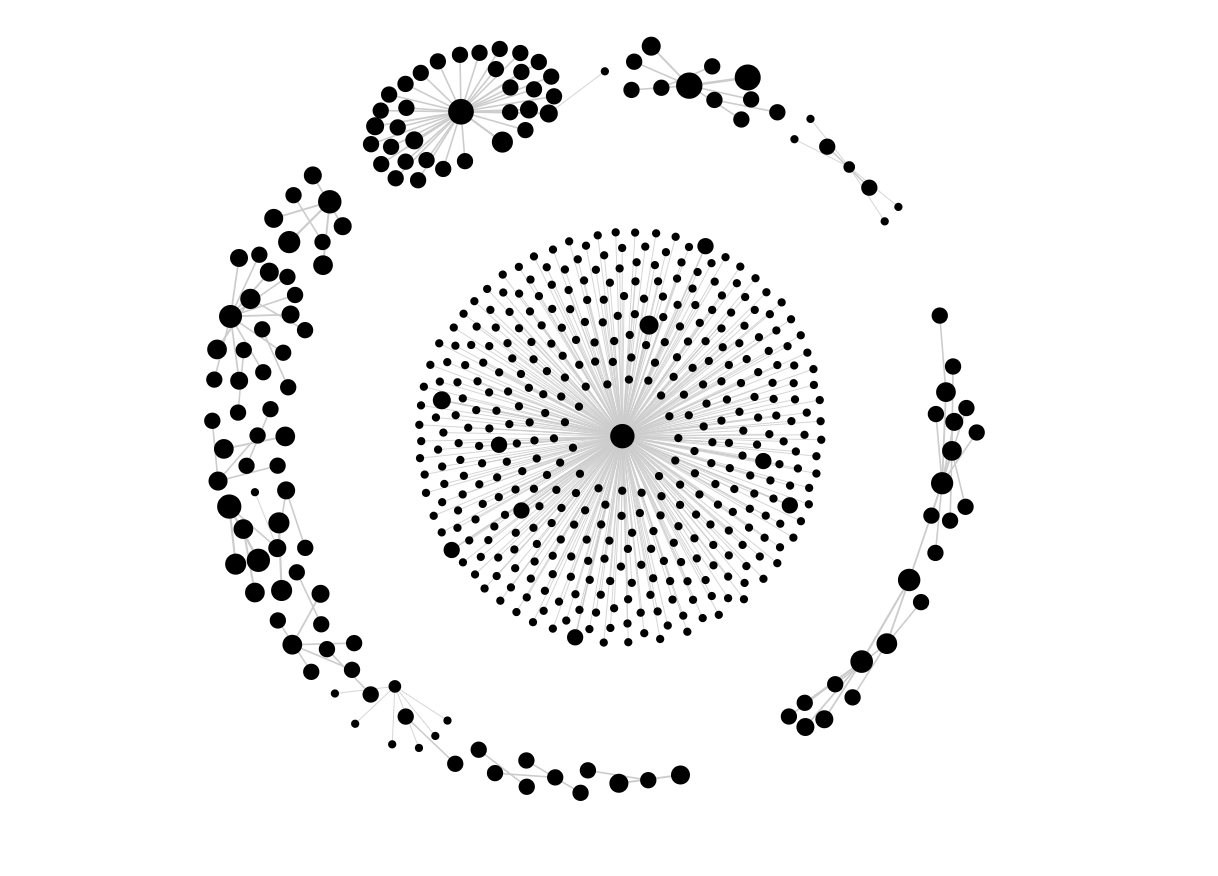
Figures above show that there is no significant change in terms of the overall transaction structure on Ethereum. The transaction graph is divided into several components. Among them, the largest component will have an obvious central node, and many other nodes around it will develop transaction relationships with it. A possible guess is that this node is an important financial institution, who attracts many individual or organizational users to conduct transaction with it on Ethereum. In terms of the other components of the graph, some have a center and present a “core-periphery” structure, while others are more decentralized and every node enjoy quite equal status in the transaction structure.
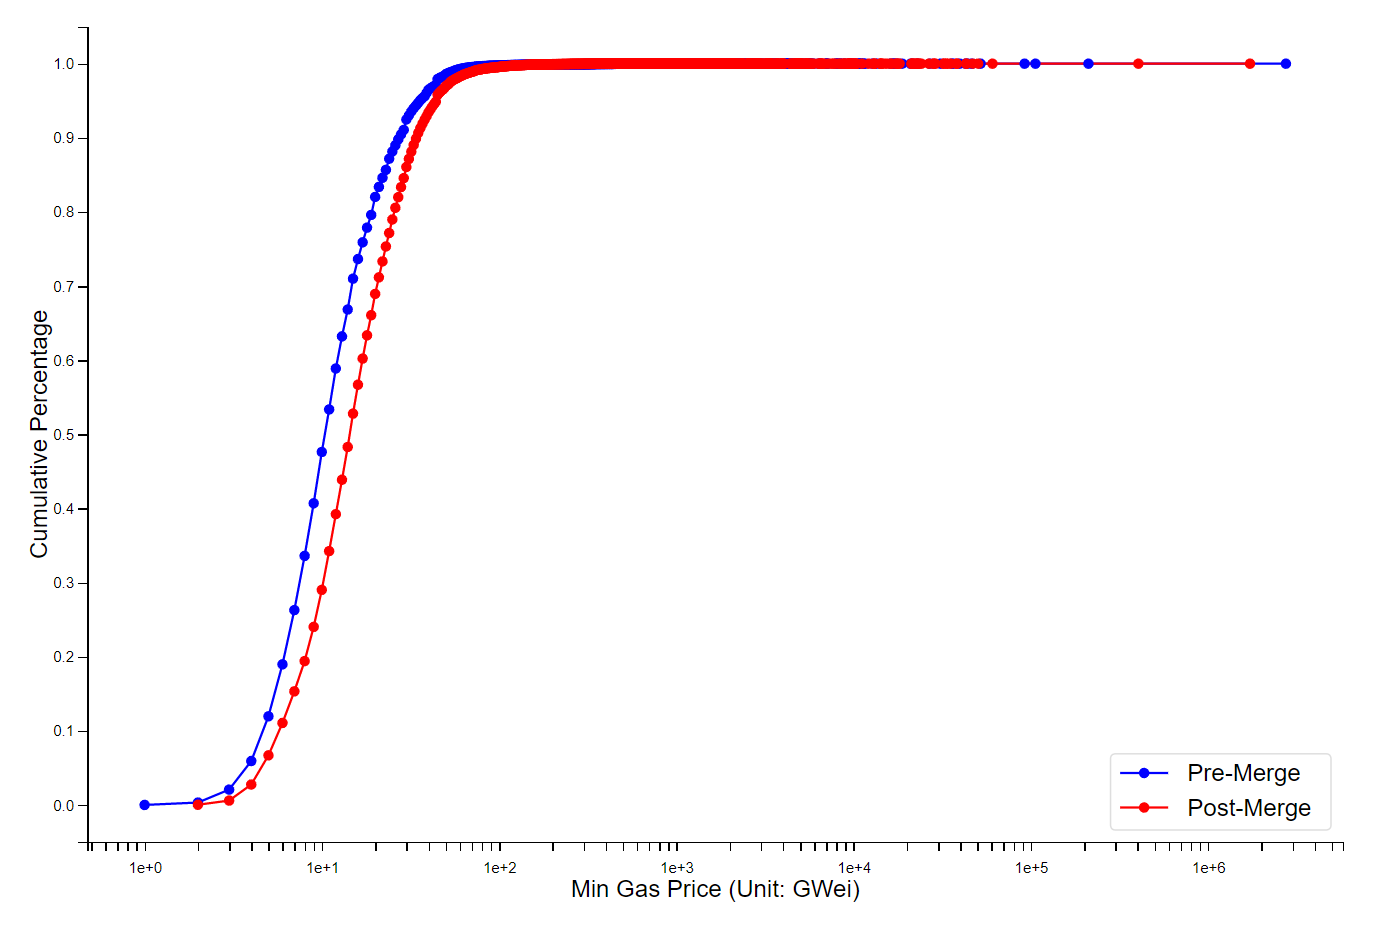
In Fig above, it can be seen that at a low price, the Post-Merge red line is below the Pre-Merge blue line, which suggests that the proportion of transactions with low gas price decreased after The Merge. The trend is verified by the increased average gas price from the Pre-Merge 14.99 to the Post-Merge 19.11 (unit: GWei). This indicates that after The Merge, there may be a growing extra cost paid for every transaction.
Gas Price Prediction
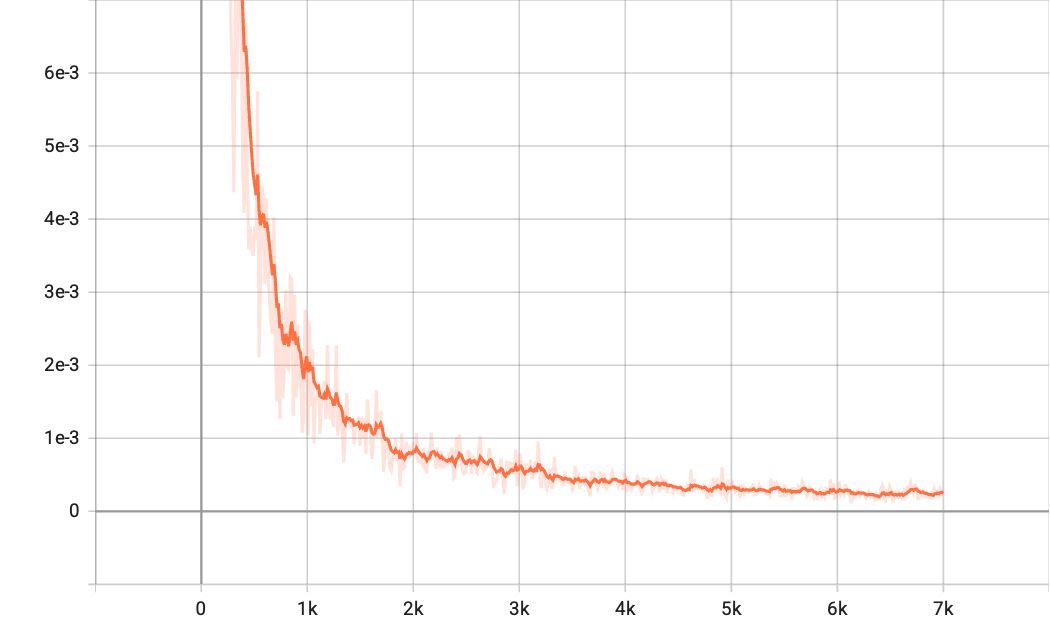
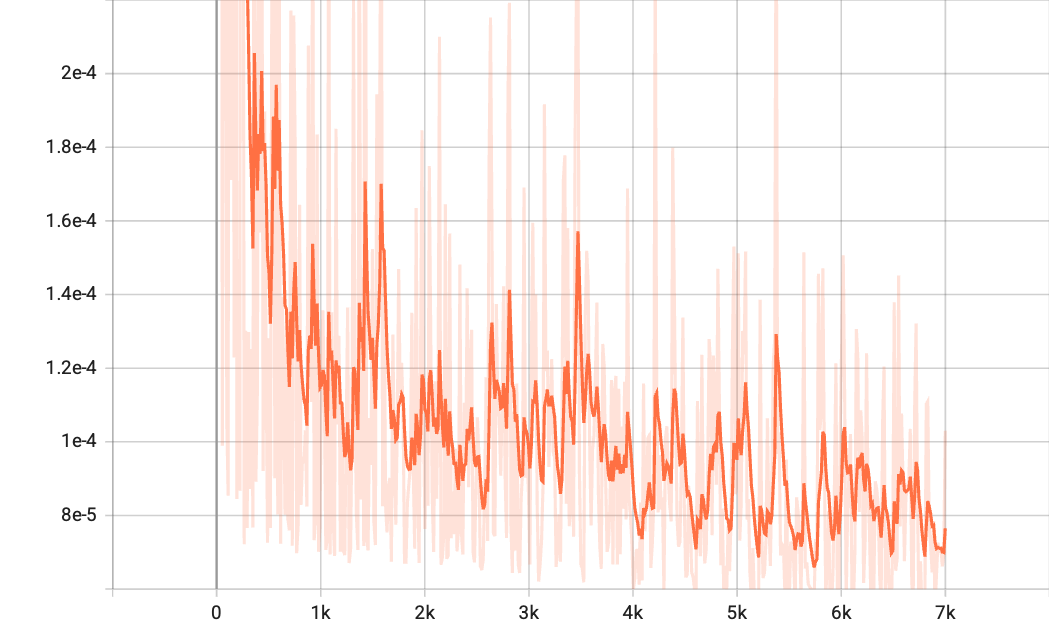
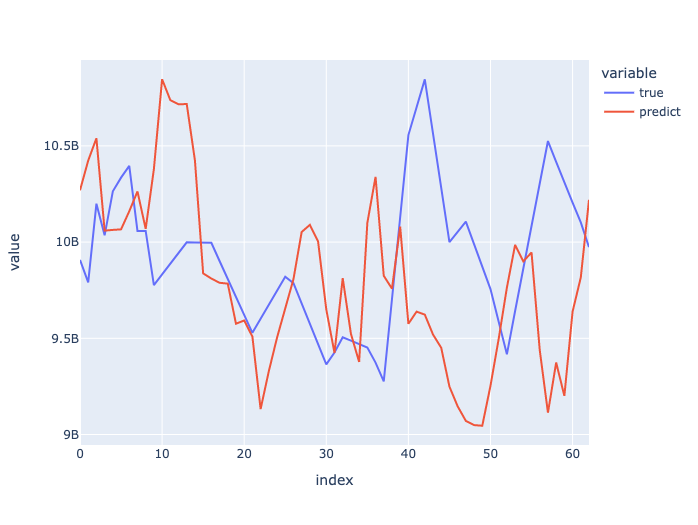
To evaluate the performance of the proposed model, we used Mean Square Error(MSE) $MSE=\frac{1}{N}\sum_{i=1}^N(y_i-\hat{y}_i)^2$. After 500 episodes, we observed that the train loss curve and validation loss curve both drop as the training continues. We apply the trained model to predict on the test dataset, where we discovers that the predicted value is close to the real value and has the similar trend as the real value. Therefore, the model can provide informative gas price prediction for users.
For more details, please see my report and code: Report, Code